
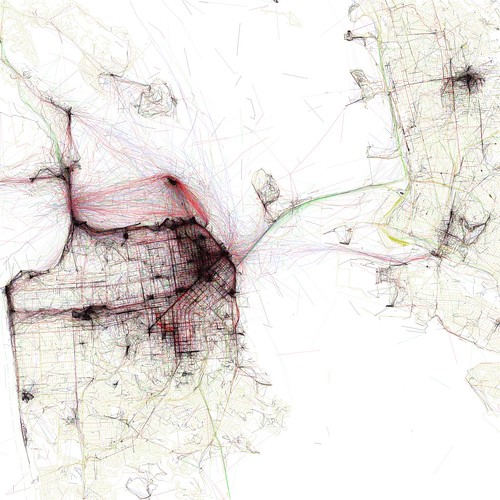
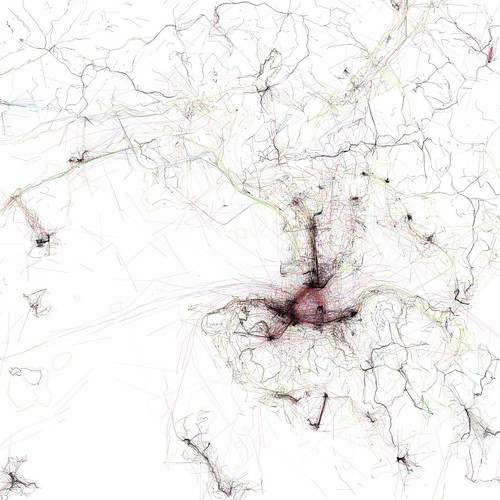
Photographer Eric Fischer is doing some pretty darn cool data visualization in his set, The Geotaggers’ World Atlas. Using geo-tagging tools, his imagination and some fancy Perl scripts, Eric is plotting Flickr photos on a map and highlighting 50 major cities in a vector view. Shown above are New York, San Francisco and Hong Kong. The different colors represent different modes of transportation: Black is walking (less than 7mph), Red is bicycling or equivalent speed (less than 19mph), Blue is motor vehicles on normal roads (less than 43mph); Green is freeways or rapid transit. Lines never looked so cool.
Photos from Eric Fischer.