Beauty in vectors

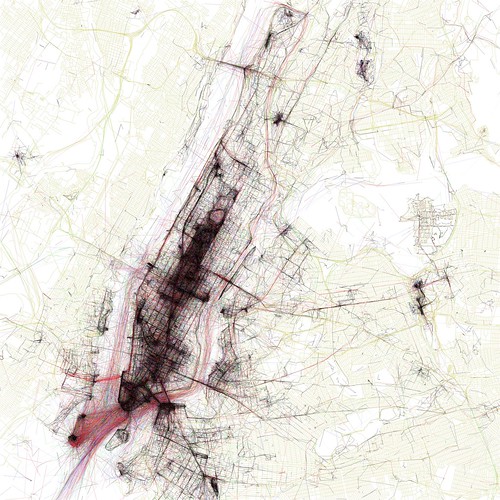
The Geotaggers' World Atlas #1: New York

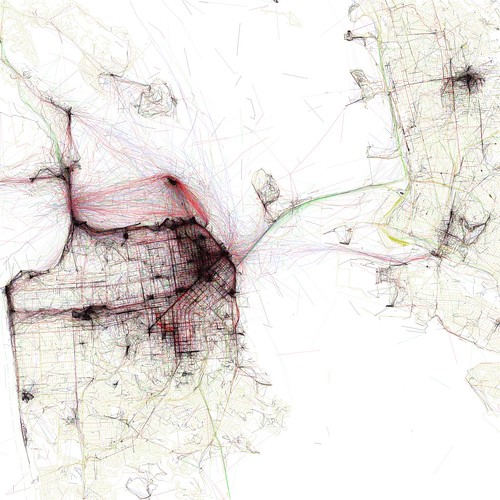
The Geotaggers' World Atlas #4: San Francisco

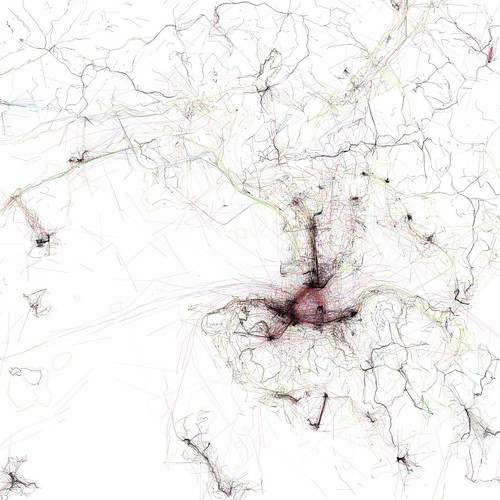
The Geotaggers' World Atlas #13: Hong Kong

Photographer Eric Fischer is doing some pretty darn cool data visualization in his set, The Geotaggers’ World Atlas. Using geo-tagging tools, his imagination and some fancy Perl scripts, Eric is plotting Flickr photos on a map and highlighting 50 major cities in a vector view. Shown above are New York, San Francisco and Hong Kong. The different colors represent different modes of transportation: Black is walking (less than 7mph), Red is bicycling or equivalent speed (less than 19mph), Blue is motor vehicles on normal roads (less than 43mph); Green is freeways or rapid transit. Lines never looked so cool.

Photos from Eric Fischer.

Posted By
Larissa Zimberoff

Larissa Zimberoff is a freelance writer based in New York. Her work has appeared in the Wall Street Journal, Washington Post, Salon, Millions, NY Observer, Huffington Post and more.

Beauty in vectors

The Geotaggers' World Atlas #1: New York

The Geotaggers' World Atlas #4: San Francisco

The Geotaggers' World Atlas #13: Hong Kong

Photographer Eric Fischer is doing some pretty darn cool data visualization in his set, The Geotaggers’ World Atlas. Using geo-tagging tools, his imagination and some fancy Perl scripts, Eric is plotting Flickr photos on a map and highlighting 50 major cities in a vector view. Shown above are New York, San Francisco and Hong Kong. The different colors represent different modes of transportation: Black is walking (less than 7mph), Red is bicycling or equivalent speed (less than 19mph), Blue is motor vehicles on normal roads (less than 43mph); Green is freeways or rapid transit. Lines never looked so cool.

Photos from Eric Fischer.

Posted By
Larissa Zimberoff

Larissa Zimberoff is a freelance writer based in New York. Her work has appeared in the Wall Street Journal, Washington Post, Salon, Millions, NY Observer, Huffington Post and more.